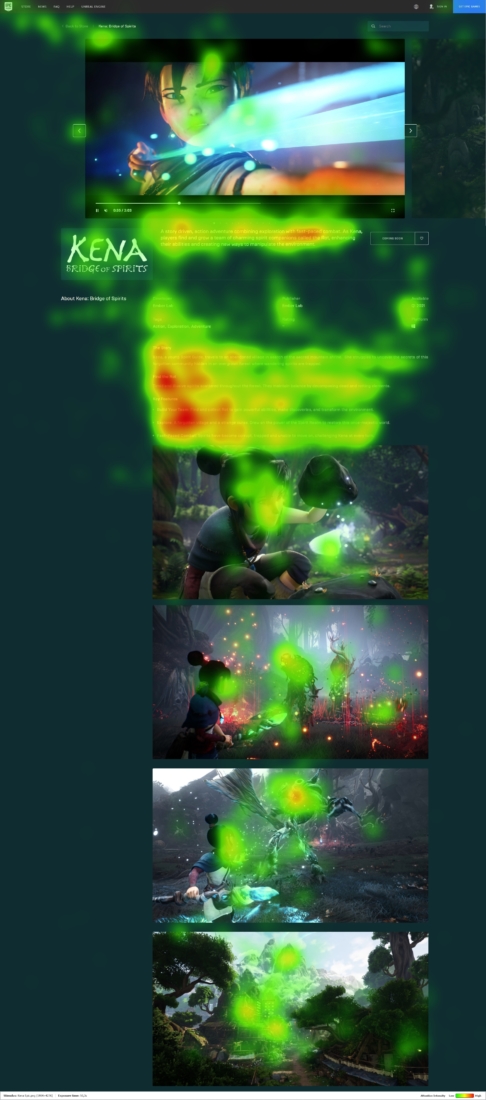
Heatmaps are static or dynamic aggregations of points (fixations) where respondents were looking during the study. They show the distribution of visual attention. With color–coding, they visualize and provide easy–to–understand information on elements of the screen that draw the most of players’ attention. The warmer the color, the more visual attention and from more players focused given point on the screen. Places without color were not looked at by the respondents.
